Your new intranet is in place and staff are starting to use it. Now it’s time to investigate what, when and how they are using it with the help of an intranet report.
In this post we’re going to quickly review 7 main Google Analytics reports that will allow you to clearly benchmark intranet effectiveness.
(Note: You’ll need to have Google Analytics setup and installed on your intranet.)
Google Analytics has hundreds of different reporting options, so there’s many to choose from when conducting an intranet health check. We’re going to focus on two main areas:
- How they’re accessing
- What they’re accessing
For more in-depth information on what to measure, why and how i.e. tools you can use to conduct your intranet report, consult our Intranet ROI calculator.
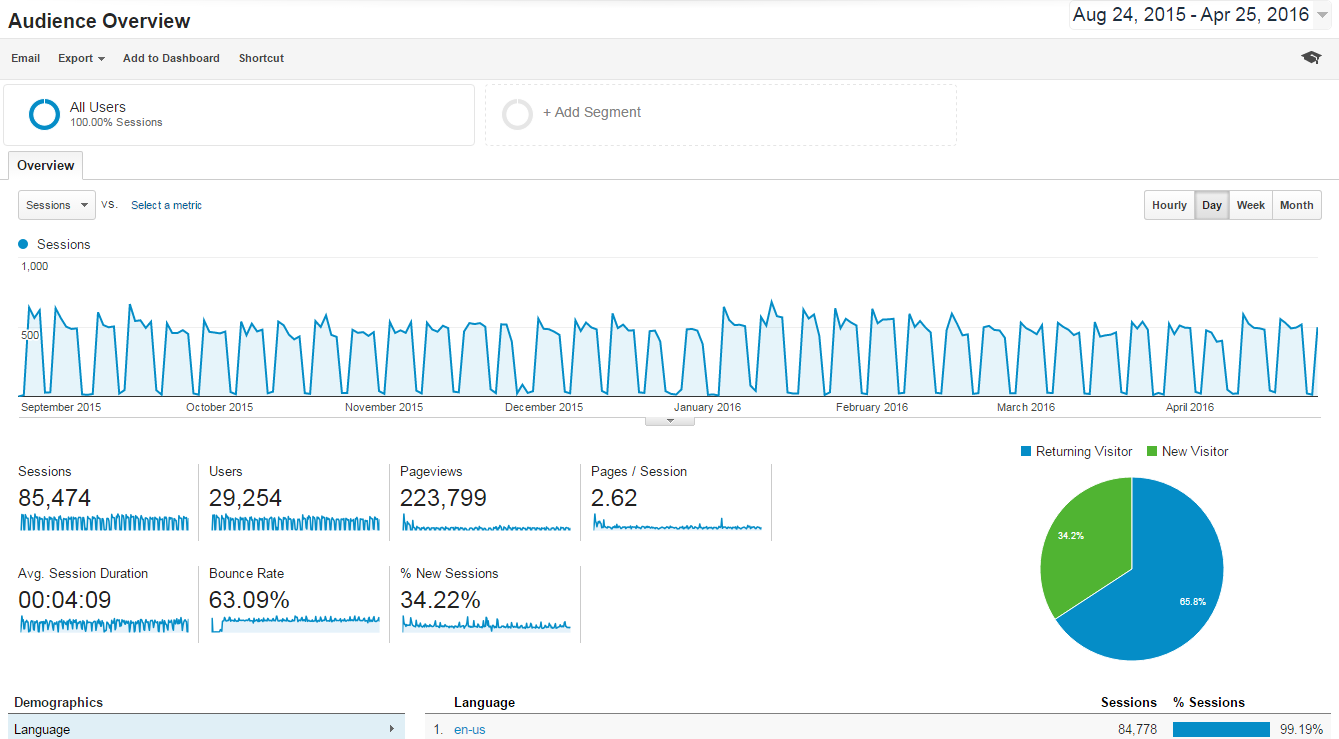
Report 1: Audience > Overview
The first report to check is the Audience Overview report - it includes useful stats including number of users, number of sessions and how many pages per session staff typically spend when visiting the intranet.
Some notes on terminology:
- A user refers to a person who has accessed the intranet on a specific device.
If a person accesses the intranet on two different devices (eg their laptop and their phone), this will be counted as two users by Google Analytic. Intranet user details are kept anonymous by Google Analytics, meaning it can’t connect that the same person has logged in on different devices (see full definition here).
- A session refers to the activity of a person during a set period of time. If a person is inactive for more than 30 minutes, when they next interact with the intranet it is counted as a new session (see full definition here). Thus a person who uses the intranet throughout the day would normally have multiple sessions.
The advantage of these details is they highlight the overall engagement of your intranet. Don’t fixate on benchmarks for you intranet, instead focus on longer term trends eg:
- Are more staff using the intranet each month?
- Are they visiting more pages each visit or less?
- When they visit do they spend longer or are visits getting shorter?
When measuring your intranet, it's important to study these trends. Longer term trends highlight whether your intranet health is improving, or needs attention.
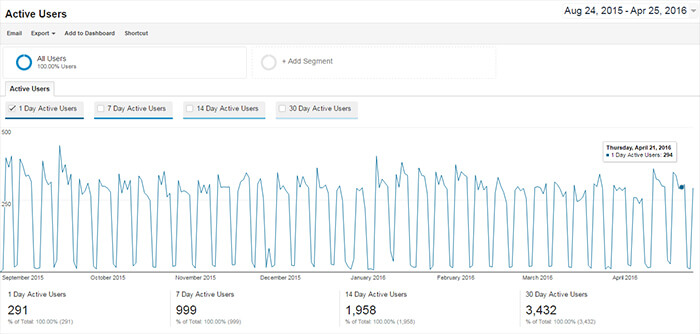
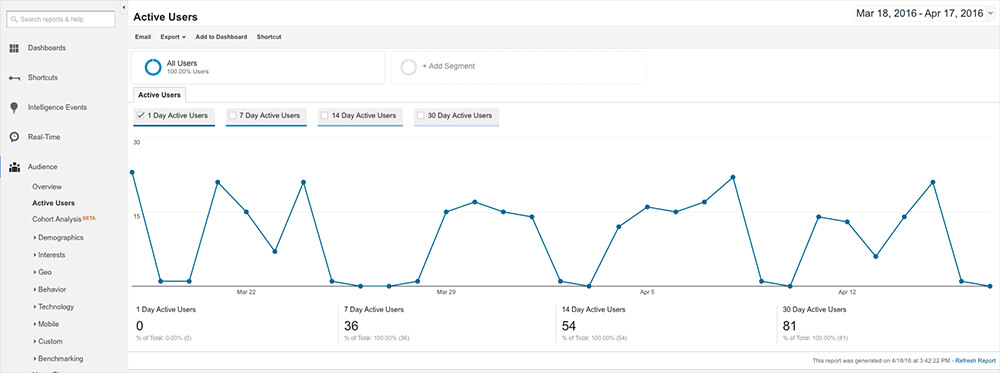
The Active Users report includes details on the active users on your intranet. Active users are the number of unique users who initiated sessions on your intranet. If a person accesses the intranet throughout the day at different times they will count as one active user (even though they have had multiple sessions). Note as per earlier notes, if they accessed using two different devices they will count as two active users.
The above screenshots have been provided by an Elcom intranet customer.
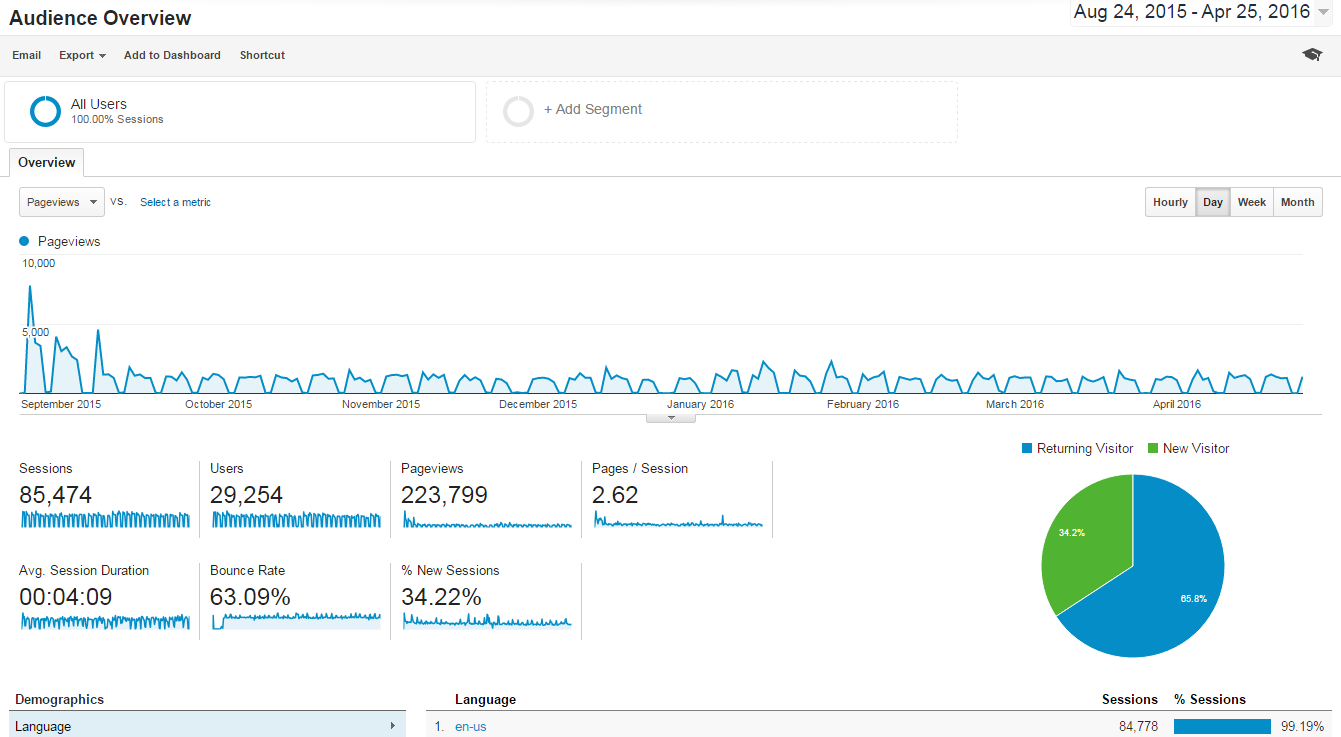
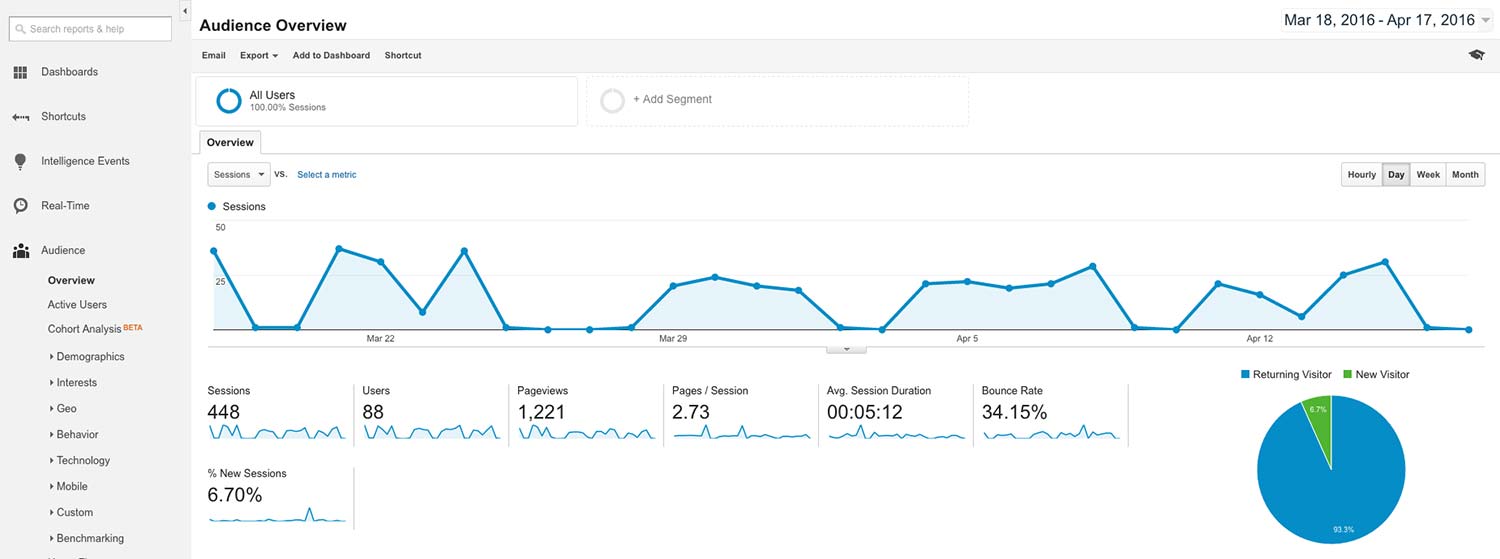
The below screenshots are from a demo site, used to indicate likely trends you’d see for a smaller, less active intranet:
Report 2: Audience > Mobile > Overview
This report highlights the mobile usage of your intranet. Typically you’ll see the mobile usage growing as staff access the intranet from outside the office.
Look for issues as well e.g. if staff are spending much less time via mobile then it may highlight an issue with the mobile friendliness of your intranet.
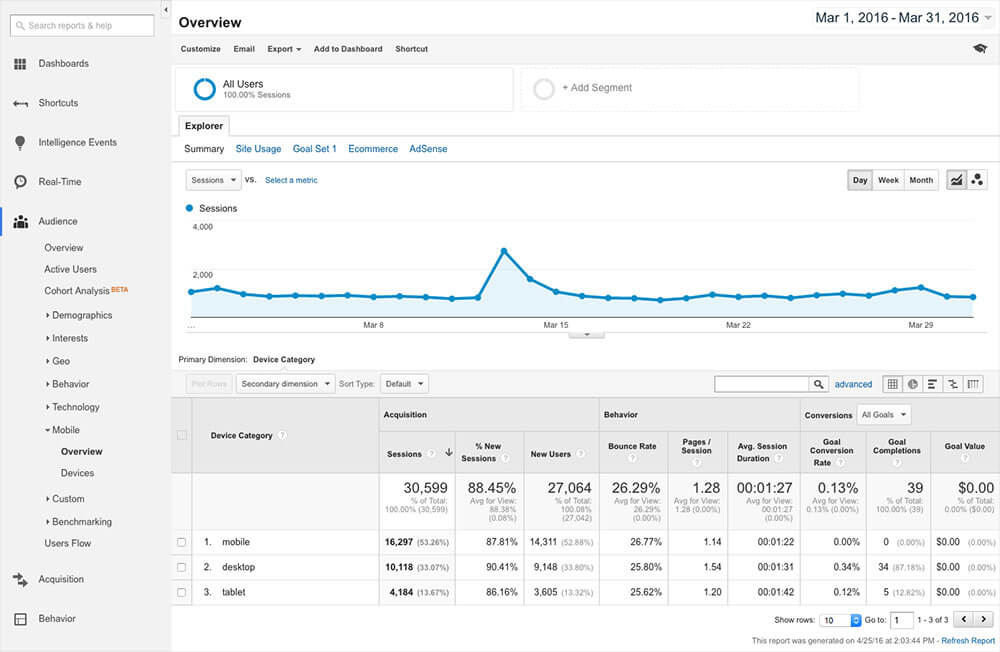
The above is an example report indicating how the Device category shows mobile, desktop and tablet users. Notice on this site that Mobile is the main viewing device, even more so than Desktop.
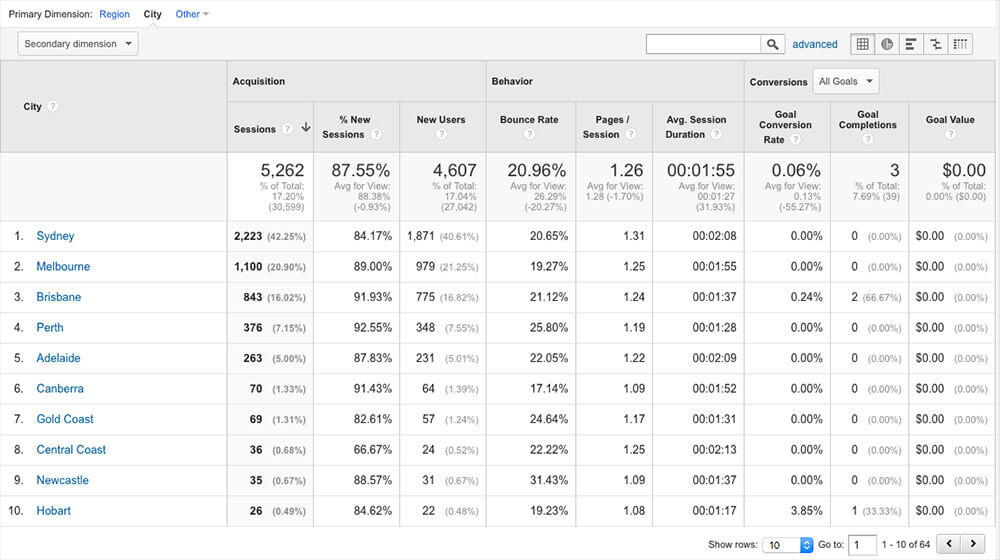
Report 3: Audience > Geo > Location
This is especially interesting for larger companies with multiple offices. The Location report allows you to hone in on which locations are the most engaged.
The following screenshots highlight the report format:
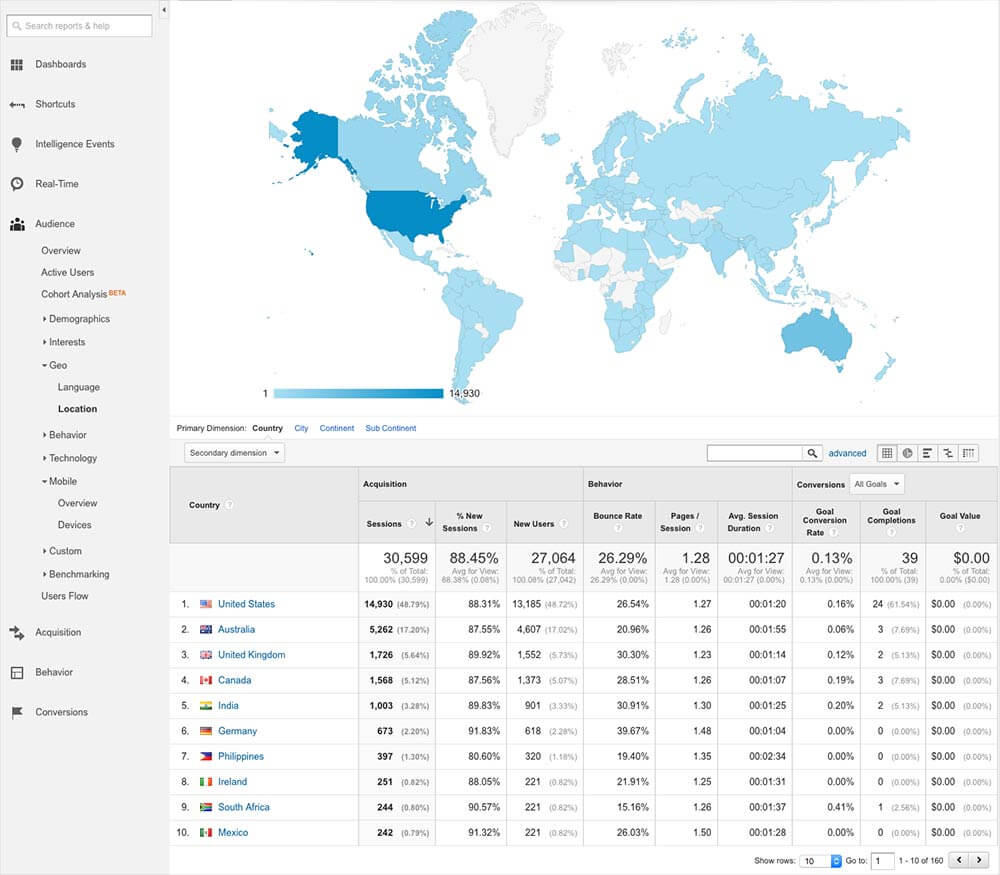
The countries can be further drilled into and viewed down to the city level as well:
Report 4: Behaviour > Site Content > All Pages
Which pages are the most popular on your intranet? And is this changing each month?
Identifying popular pages is a useful indicator of the pulse of the company and to benchmark intranet engagement. For example, when social activities are covered, or community items such as fund raisers are popular on the intranet they can highlight high staff morale and interest in company initiatives.
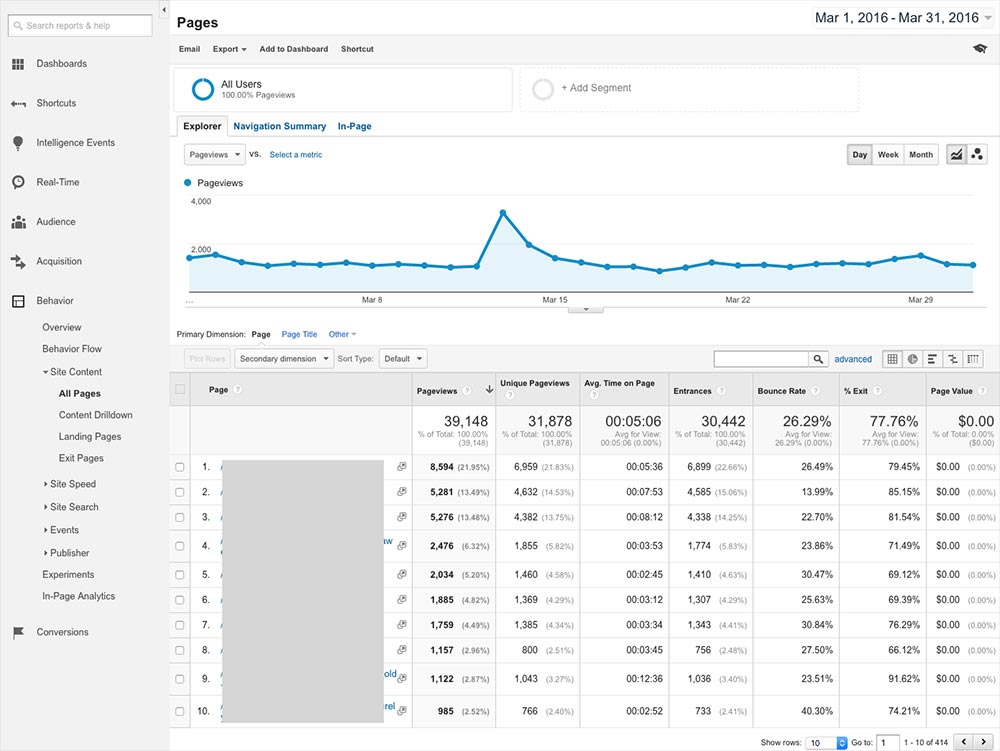
The above screenshot is an example of the kind of activity you may see in your intranet report - look for spikes in traffic and then narrow your date ranges in order to highlight the content that was particularly relevant during the spike.
Report 5: Behaviour > Site Content > Content Drilldown
The Content Drilldown report is useful for seeing how each section of your intranet is working. Most intranets will have a structure that includes key categories (eg IT, HR, Latest news, etc). The URL structure of your intranet will allow each grouping of these in reports, allowing you to view which sections are the most popular and which must be targeted to improve company intranet success.
This report can also be useful for identifying seldom used sections - so they can be refreshed, or even removed if no longer needed.
Report 6: Behaviour > Site Content > Landing Pages
Landing pages are the pages that staff enter the intranet via. While many staff will land on the intranet Home page, there are plenty of good reasons why internal pages may be the first page an employee arrives at: for example if a company wide email includes a link to a Company announcement on the intranet.
Landing page reports are useful for indicating key pages that staff are interested in - and may be an indication they should be added to the home page or main navigation items as well.
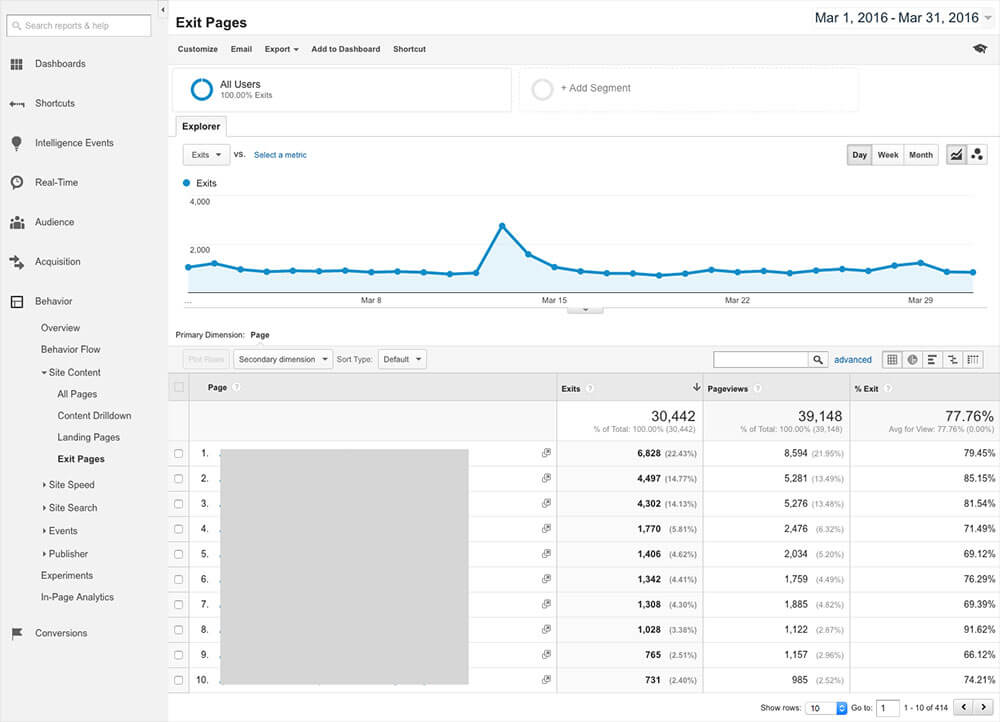
Report 7: Behaviour > Site Content > Exit Pages
Keeping an eye on exit pages can be useful for identifying problem areas. For example consider a Leave form on the intranet that when filled out takes users to a confirmation page. If the confirmation page is the Exit page this is likely healthy. However if the Leave form itself is the Exit page this may indicate issues with the form that need to be addressed - since staff don’t seem to be able to proceed past it.
Report 8: Acquisition > All Traffic > Channels
How are most of your staff accessing your intranet?
You’d likely assume most access would be Direct - that is, they’ve typed in the intranet address, or they have it set as a bookmark.
But you may find some important behaviours here - for example, consider the impact if you discovered a large number of staff were coming via Google?
There’s many reasons this might happen, eg:
- The company intranet is new and hard to find
- Staff are on a new device and don’t have a link/bookmark to the intranet
- They’ve forgotten the URL of the intranet
- People instinctively just enter search terms in the browser address bar
It’s why you’ll see Google search results such as this becoming more common:

Seeing a large organic source of traffic to your intranet is a sign that it’s easier to simply let Google find the intranet for staff. And thus having the intranet home page appear in Google is becoming more common for companies, due to this benefit. (Just be sure that the rest of the intranet is protected behind a login form!).
Common Channels for your intranet will include:
- Direct
- Email
- Google
- Referral (eg from other company owned websites)
Companies are increasingly seeing access come via apps, messaging programs and other collaboration tools e.g. if you use a tool such as Slack for company messaging and staff add links to intranet pages from there, within Google Analytics, these will usually be grouped as part of the Direct channel.
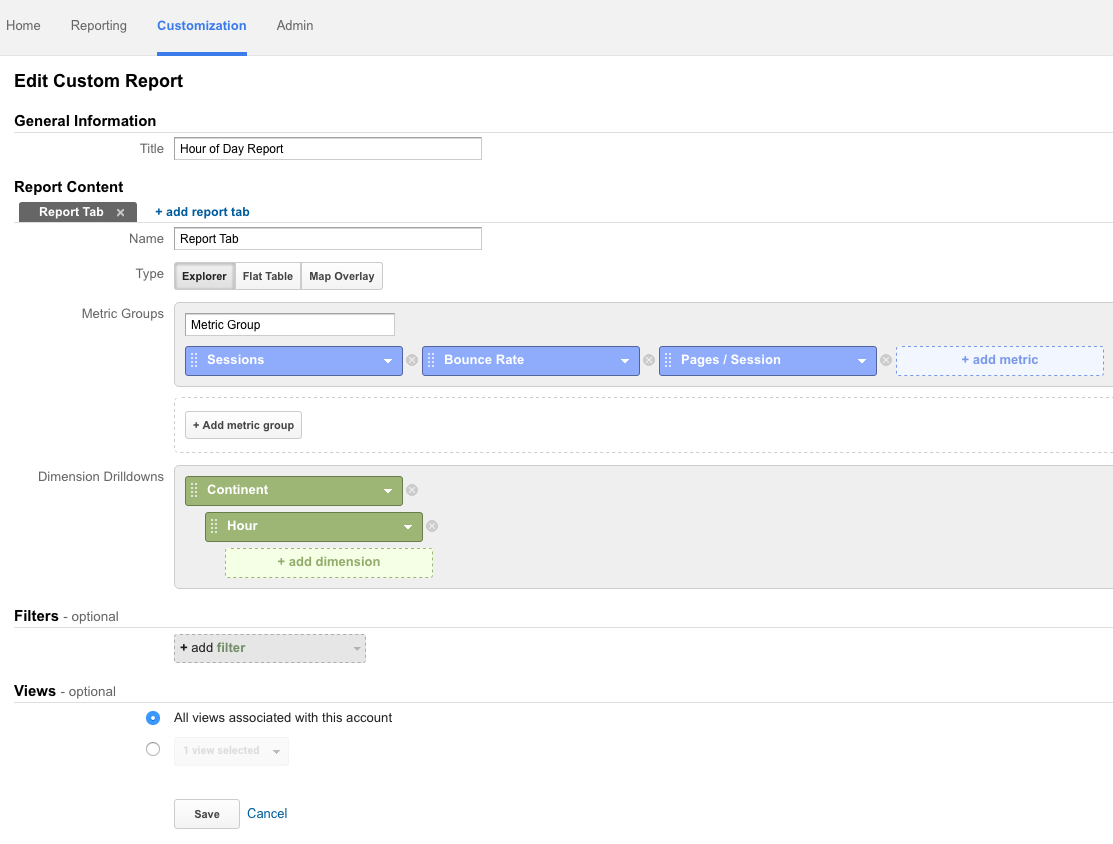
Bonus Intranet Report: Custom Report with Time of Day
Interested in knowing the busiest times of the day for your intranet?
You can use the Custom Reports section to build reports for Time of Day.
Click on the Customisation menu item and then add a new report, using the following layout as a guide.
If your company has staff across multiple countries it helps to group these by continent so you can drill into the hours in each location.
Your Turn
Which intranet reports do you use to measure your engagement? And are there any new aspects of intranet ROI that you are interested in incorporating into your intranet report? Explore further ways you can assess and integrate the data of your intranet report with our 8 Smart Ways to Measure Your Intranet Performance.