As more and more organisations edge further towards becoming digital, data has become increasingly important as a key driver of employee engagement in an increasingly distributed workforce, as well as a tool to aid productivity, inform business decisions and gain insight into all manner of business processes. All companies generate a huge amount of data these days. This comes from numerous sources such as finance, sales, web activity and even social media.
McKinsey & Company point out,
"In industry, all organisations create data, and as storage costs continue to tumble, more of it is being kept and analysed to create competitive advantages... Empowering people with analytics—that’s where the real value creation occurs."
Collating and presenting data in such a way that it’s understandable and useful to the end user is no longer the complex process that it once was. Modern data dashboards for intranets are capable of pulling both historical and real time data from various sources in order to display it in a visual manner that provides insights.
Whilst dashboards should be championed by executives, if they are going to be valuable across the organisation, they can be used by anyone and it’s not always necessary that the user be an analyst or data scientist. Dashboards, when implemented in the right way on the intranet, can provide a window into the everyday operations and processes of a business in order to help better decisions to be made.
An Australian intranet and dashboard solution provides the detail and functionality to handle even the most complex of organisational needs and provide a seamless, personalised experience for your intranet users.
So there’s little doubt that data analytics – and in turn dashboards – are proving to be incredibly useful to businesses from a wide range of industries when it comes to measuring intranet effectiveness, as well as making better decisions and improving business operations and processes.
How to Choose a Data Visualisation Dashboard
Selecting the right data visualisation dashboard is an integral part of monitoring your intranet. An appropriate dashboard can provide you with valuable insights, assist in making informed decisions, and facilitate overall business growth. Here's a comprehensive guide to help you make a well-informed choice:
1. Identify Reporting Needs
The first step in selecting a data visualisation dashboard is identifying what you want it to achieve. For instance, you might be interested in supporting remote workers and monitoring engagement, tracking website traffic, monitoring content performance, or understanding user behaviour.
Your dashboard should be able to present the data relevant to these metrics in an understandable and actionable manner. Also, consider the frequency of these reports; will you require daily, weekly, or monthly reports? Your chosen solution should align with these needs.
To choose the best dashboards for your business, you will need to carry out a questionnaire which can help you to determine the type of dashboard needed.
It will be necessary to consider:
- What business problem requires solving
- What personnel/departments will be using the dashboard
- Are there gaps in the business’s performance – if so, where
- What are the goals of the organisation
- How is data currently used/stored
- How many data sources does the business currently have
Depending on the dashboard that you choose, it may be that you can only pull data from one source. If however your data exists in various places, then it will be necessary to implement a dashboard that pulls data in from numerous sources.
2. Set Your Budget
Once you've outlined your reporting needs, it's time to consider your budget. The costs for visualisation solutions vary significantly, from free options to premium services costing thousands of dollars per month. However, remember that the most expensive solution isn't always the best fit. Instead, the ideal solution will be the one that provides the features you need within your budget.
3. Compare Different Solutions
Next, start comparing different solutions. There are numerous dashboard solutions in the market, including Google Analytics, Power BI, Tableau, and more specialised options. Analyse each solution's features and pricing, and determine how they align with your reporting needs and budget. For example, if you choose to monitor intranet metrics on Google Analytics, look out for whether it has an intuitive interface, real-time data access, customisation options, integration capabilities with your existing tools, and excellent customer support.
4. Try Out a Few Different Solutions
After narrowing down your choices based on features, pricing, and alignment with your needs, it's time to get hands-on experience. Many providers offer free trials or demos of their products. Take advantage of this opportunity to familiarise yourself with the solution. Check if it's user-friendly, if it integrates well with your existing tools, if it provides actionable insights, and if it meets your overall expectations. Also, take note of the provider's customer service quality during this trial period.
5. Finalise Your Decision
Following your research and trial period, you should be ready to make a final decision. Keep in mind that the perfect solution will not only fulfil your immediate needs but also scale with your business as it grows. Revisit your original reporting needs, budget, and the features of each potential solution. Balance these aspects and consider how they fit into your overarching business strategy.
What Makes a Good Intranet Visualisation Solution?
Choosing the right data dashboard solution for your intranet requires careful consideration. The ideal visualisation tool should not only present data in an easily understandable format but should also be easy to use, scalable, secure, and reliable. Here, we delve into these elements that make for a robust intranet visualisation solution.
1. Ease of Use
The intranet dashboard interface should be intuitive, reducing the learning curve for new users. Functions like drag-and-drop, one-click reporting, and simple data importing/exporting can make the tool user-friendly. Visual aids like graphs, charts, and heat maps can further enhance understandability, enabling users to digest information quickly and make informed decisions.
A good dashboard should include understanding intranet usability and user experience. Dashboards can and do shape how employees engage with the intranet itself, so it pays to ensure that they’re not so complex as to put users off. When evaluating vendors, look carefully at how information is displayed and how easy it is to apply filters and perform other tasks through the dashboard interface. Compare the differences between an intuitive intranet dashboard vs SharePoint – we even have a handy guide for this. Consider intranet design guidelines and intranet design best practices.
Responsive dashboards are also now available, so also ask yourself how mobility will fit into the equation. Does your organisation have a lot of workers in the field who might want to access a sales dashboard on a smartphone or tablet, perhaps? Or maybe a proportion of your workforce works from home – consider how the user is going to access the dashboard for the best chance of success.
2. Scalability
Your intranet visualisation solution needs to be scalable to accommodate your organisation's growth and changing needs. As your business expands, so does the volume and complexity of your data. The chosen tool should be able to handle increasing data volumes without compromising performance.
Scalability also refers to the tool's ability to evolve with your needs. It should offer customisable features and allow for new integrations as necessary. As your organisation grows, your goals and metrics may change, and your visualisation tool should be flexible enough to adapt to these changes.
3. Security
Given that you might be dealing with sensitive business and customer information, security is paramount. Your chosen solution should adhere to the highest security standards and comply with relevant data privacy laws.
Look for features like data encryption, user authentication, role-based access, and audit logs. It should also have robust policies for data backup and recovery in case of any unforeseen circumstances. Make sure the provider is transparent about their data handling policies and can assure you of the security and privacy of your data.
4. Reliability
Reliability is another essential characteristic of a good intranet visualisation solution. The tool should be available when you need it and capable of providing real-time data updates. Any delays or downtime can lead to misinformed decisions or missed opportunities.
Reliability also extends to the tool's accuracy. The solution should offer error-free reporting and visualisation to ensure you base your decisions on accurate and timely data. Furthermore, it should have excellent customer support to address any issues or queries promptly.
Intranet Dashboard Types
There are around six different types of dashboards for intranets to consider, but for the majority of enterprises, it is only necessary to look at three – strategic/executive dashboards, operational dashboards and analytical dashboards. Operational dashboards display key KPI information that allows the user to see if they are on target for their objectives for that day, week, month, or year. These tend to use real time data in order for the user to instantly have a snapshot of how the chosen objective is performing.
Operational dashboards are ideal for managing day-to-day processes that frequently change and require less technical knowledge than analytical dashboards. In short, operational dashboards are meant to help an organisation understand if its performance is on or off target, and by how much, in real time. This allows an organisation to quickly respond to any changes and act on them. For example, the dashboard for clothing retailer, Taking Shape, displays graphs of the sales performance of each store with their targets. Figures are updated automatically 3 times a day to ensure staff receive the latest data.
Analytical dashboards focus more on historical data and are used to gain intranet insight into what has taken place in the past and how it can be improved upon in the future. For example, the marketing department might want to compare how one campaign carried out in the previous quarter, compares to one carried out in the current quarter.
Or, it could be that marketing wants to track the success of a campaign not only by making a direct comparison, but they could integrate sales and product placement data to see how and why which campaign has been more successful. So analytical dashboards can help an enterprise to better achieve targets by examining historical data.
Strategic or executive dashboards are designed to give executives an overview of KPIs that can be tracked by company executives periodically in order to gain a high-level overview of the company and its performance. This type of dashboard will typically allow execs to view data such as:
- Revenue by quarter/year
- Costs compared to previous periods
- Sales performance
- Staff headcount by department
Intranet Dashboard Areas
There are different types of intranet dashboards that can be used in different areas of the business. And as discussed earlier, there are also dashboards that display historical or real time data – or a combination of the two.
All dashboards gather raw data and work to present it in such a way that users can gain insight into business processes and customer behaviour. Using dashboards, trends can be spotted which enable more informed, intranet performance to be improved and faster business decisions to be made.
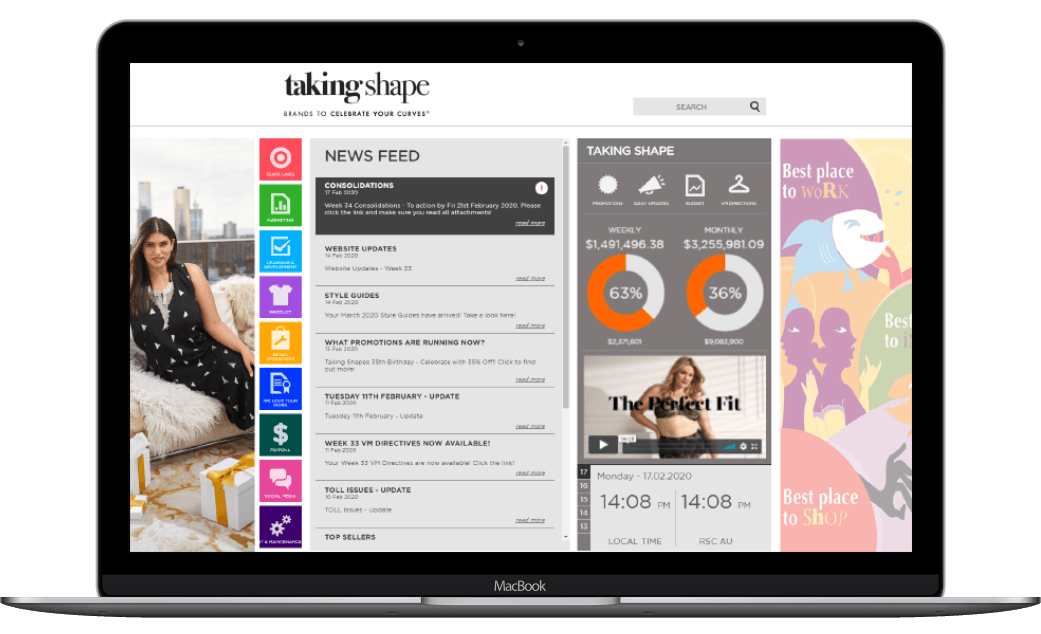
Taking Shape Intranet Dashboard
For example, if a dashboard is applied to sales operations, metrics such as product categories, customer demographics and behaviours and sales trends can be monitored in order to gain further insight into which products are popular with what audience. And when these products are most likely to see a boost in sales and much more. This can then help with planning stock control and marketing to the right demographic, at the right time.
However, sales dashboards are just one example of how a dashboard can provide insight in one area of the business. Dashboards can be equally applied to:
- Marketing – to spot KPIs, aid remarketing and more
- Stock control – to automate stock processes and ensure that the most popular products are always available, whilst reducing spends on poorly selling products and reducing overstock
- HR – to monitor the performance of staff
- Communications - to improve and promote internal communications
- Customer service – to monitor customer representative staff, incoming calls, length of calls and more
- Finance – to better understand payment cycles and financial snapshots at any given time
- Executives – to gain insight and an overall understanding of how the business is performing and where improvements can be made
- Factory floors – to help managers improve production efficiency
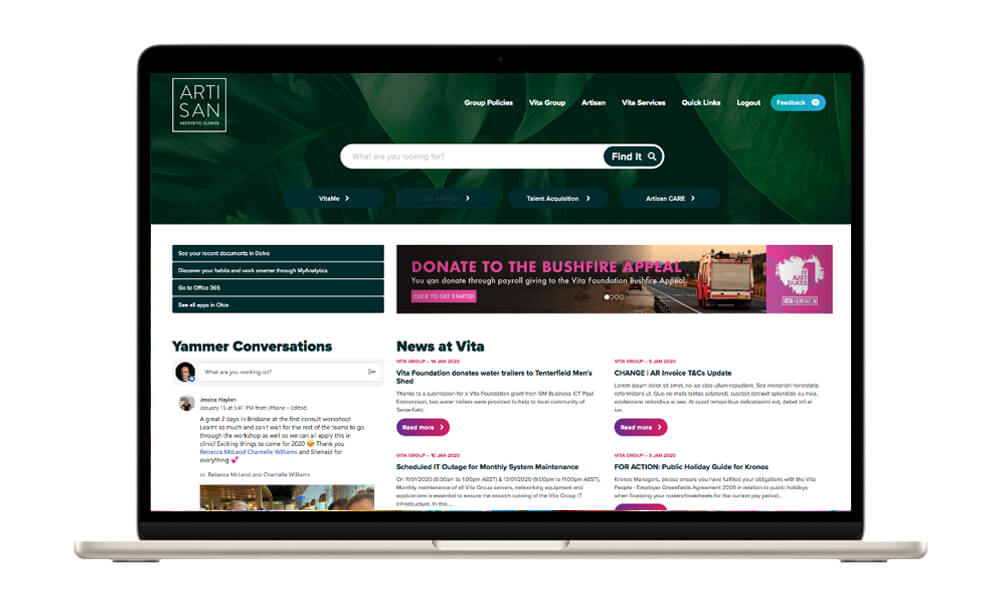
Vita Group Intranet Dashboard
This is not a full list, and it’s fair to say that there are many areas of any business where data can be used to further boost business operations and improve profits.
Implementing Intranet Dashboards
When it comes to costs, dashboards can vary quite wildly. This is because they can be tailored to suit the needs of a specific business and may require more than one element to be added.
Dashboard vendors don’t tend to advertise pricing for the reasons above, but it can be said that there are four main pricing models.
- License per user – based on how many users will be using the dashboard software or the different types of user (e.g. by department). For example, SharePoint operates on a per user license which can make it expensive for organisations with a large workforce.
- Set price per license - some vendors charge per license with no additional cost for the number of users. For example, Elcom charges a set amount for a license which can be used to build multiple websites, intranets and portals with distinct dashboards and interfaces, while offering the ability to add unlimited users at no extra cost.
- Data source licenses – some vendor’s price dashboards based on the number of data sources that the dashboard is connecting to and reading from.
- Server based license – this is priced depending on the dashboard’s capabilities, such as number and speed of processes or amount of memory that’s demanded of the dashboard.
Pricing will depend on your needs and the size of your organisation, and there’s no one set price range that we can pin down here. However, even though large dashboard implementations can be expensive, there’s no longer any doubt as to the capability of quickly gaining ROI.
Planning Your Intranet Dashboard Project
There is a lot of planning that goes into intranet projects. Dashboards do more than pull data and present it as a set of numbers. Instead, dashboards use graphs and other visualisations to help the user to quickly see where changes can be made, or not. In order for a dashboard to be successful in any department, with any user, it’s necessary to get to the core of why the dashboard is needed and what problem it will solve.
For example, in a sales dashboard, you might ask: how can we move more leads through the sales pipeline? This then is your goal for this dashboard and in order to reach it, you will need to study data in real time in order to move the customer further along. This can be achieved by calling at a specific time when your data tells you the customer is likely to be receptive, to give a simple example.
Likewise, this information could be accessed by marketing to see where in the pipeline the customer is most likely to be receptive to remarketing. It’s vital to the success of dashboards that you don’t just throw any data at it; instead,you must choose data sets carefully and understand why they will play a part.
Ask yourself how knowing this data will allow your users to better make decisions and act. Dashboards are not designed to be capable of being asked any old question and giving an instant answer, they are not Google. Instead, you need to tell them what data to display and you must understand why this data is important to each business operation or process when applied to a dashboard and the person(s) using it.
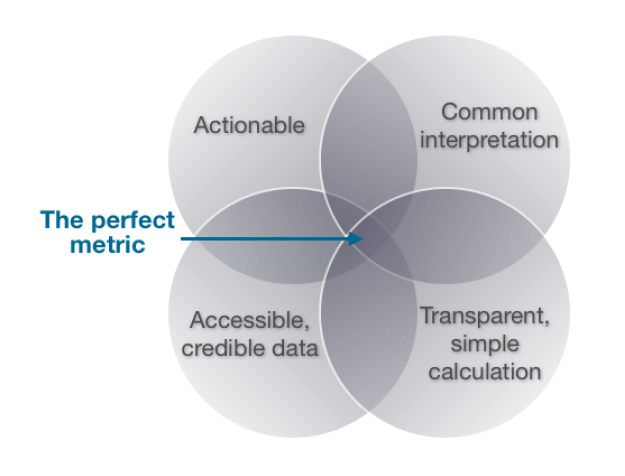
(Image source: A Guide to Creating Dashboards People Love to Use (PDF))
In the first instance then, you should choose the important metrics for each department where you’re going to apply dashboards and identify the users who will be working with them. Depending then on the type of dashboard that is going to be deployed, you should test the technical understanding of the user and determine if it’s going to be valuable to that particular user.
It’s then a case of either putting the right training in place or reconsidering if the dashboard could be better implemented for another, more technical member of staff. It’s wise to ensure that executives are included in a dashboard project, as often the success of their implementation on the intranet depends on executives leading by example.
Data Visualisation is Key to Monitoring Intranet Performance
Dashboards are a powerful addition to any enterprise and as discussed, research has shown that they can substantially and positively affect growth and financial performance. However, just as with an intranet project, they do require planning and an understanding of how they will help the business to reach its intranet KPIs and business goals.
While your intranet dashboard design will play an essential part in a successful deployment, it is also not the only aspect you’ll need to consider. To learn how to add further value to your intranet solution, you can learn more about intranet dashboard implementation, intranet dashboard pricing and our intranet dashboard templates.
We recommend you read our guide on How to Successfully Plan, Deploy and Launch an Intranet. This comprehensive guide will equip you with best practices and insights to properly plan, deploy and launch your intranet.
We also recommend that you watch the Intranet Design webinar recording to help you get the design and build right for your intranet, the first time around.
We share insights on:
- Best practice tips for intranet design and branding
- Must have features of a great company intranet
- How to tailor your intranet to each employees needs
- Where you need to start to get it right
- An award winning example to inspire your intranet design